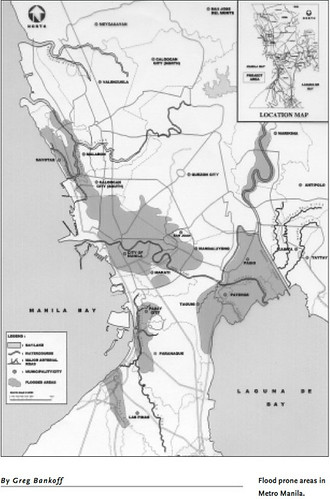
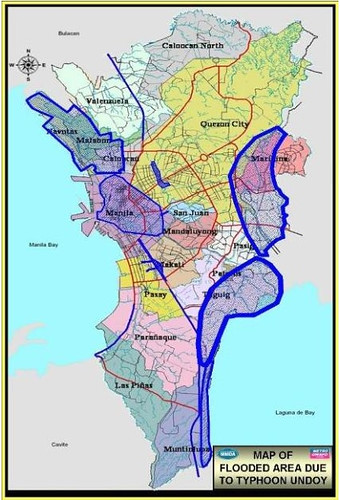
In 2003, George Bankoff provided a map showing the parts of Metro Manila susceptible to flooding due to the geology and topography of the region. When Ondoy and Pepeng took place, the widespread flooding pretty much matched the map:
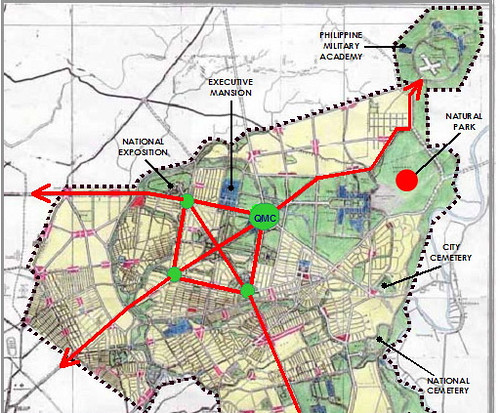
In the aftermath of the massive flooding caused by Ondoy and Pepeng, many interesting articles came out pointing out that the effects of topography on a locality’s vulnerability to flooding had long been understood. Kenneth Cardenas, for example, contrasted the original design of Quezon City, with how the City is nowadays, and where the water went during the flooding:

Let me reproduce part of my 2009 Blog Action Day Entry:
Here he illustrates the difference between the areas planned as green spaces (parks and watershed forest preserve) in the 1939 Quezon City plan, and how it turned out at present (basically: no green spaces were preserved).
The parks within the urbanized areas of Quezon City were supposed to compensate for the smaller lots that would make the city affordable for government employees and blue collar workers; while a large belt of forested watershed land (on the right side of the map) was precisely allocated because these areas were identified as flood-prone areas to begin with.
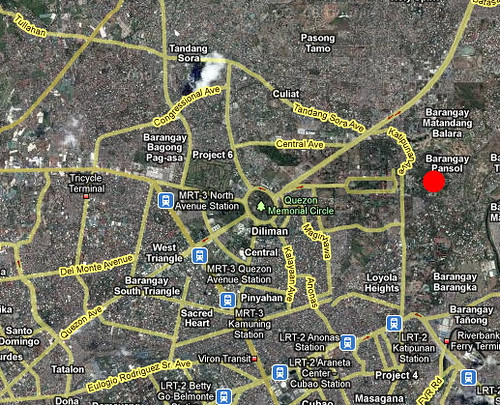
Again, contrast the planned development with how development has actually taken place, the patches of green being insignificant compared to what was deemed necessary for healthful city living.
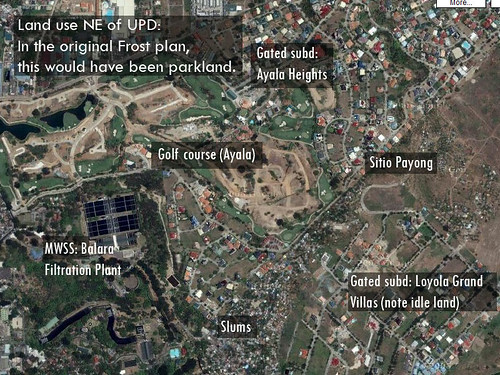
Another illustration provided by Cardenas shows what should have been parkland given over to all sorts of other uses.
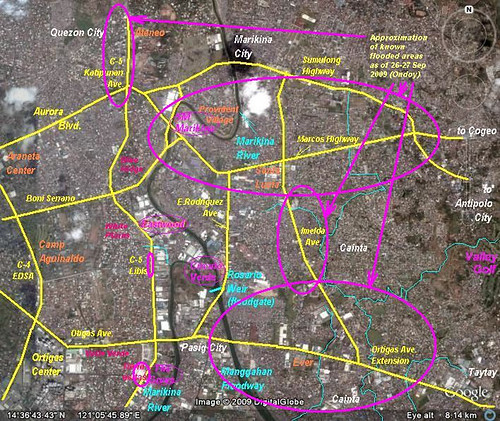
The illustration above comes from a graphic provided by environmental planner Armando N. Alli, focusing on the parts of Marikina and Quezon City that in olden times would have been filled with creeks and with a historical tendency to flood. Today it’s a big urban sprawl of shanties, gated communities, factories, roads. Alli marked out areas in magenta as the places that flooded badly. In some cases they coincide with relatively new public works, like the stretch of C-5 along Ateneo or in Libis, or part of Imelda Avenue. Such places may have sliced through natural drainage or older man-made drains, basically serving as dikes that trapped rainfall, which the concrete-covered communities couldn’t absorb, but which couldn’t drain into the Marikina River.
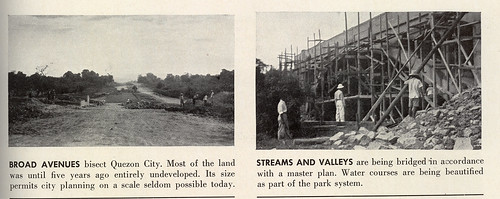
And yet, the illustration above, from 1940, shows that prewar infrastructure seemed more in harmony with the natural terrain; Alli told me that present-day roads do not provide for efficient drainage into natural channels because this is expensive.
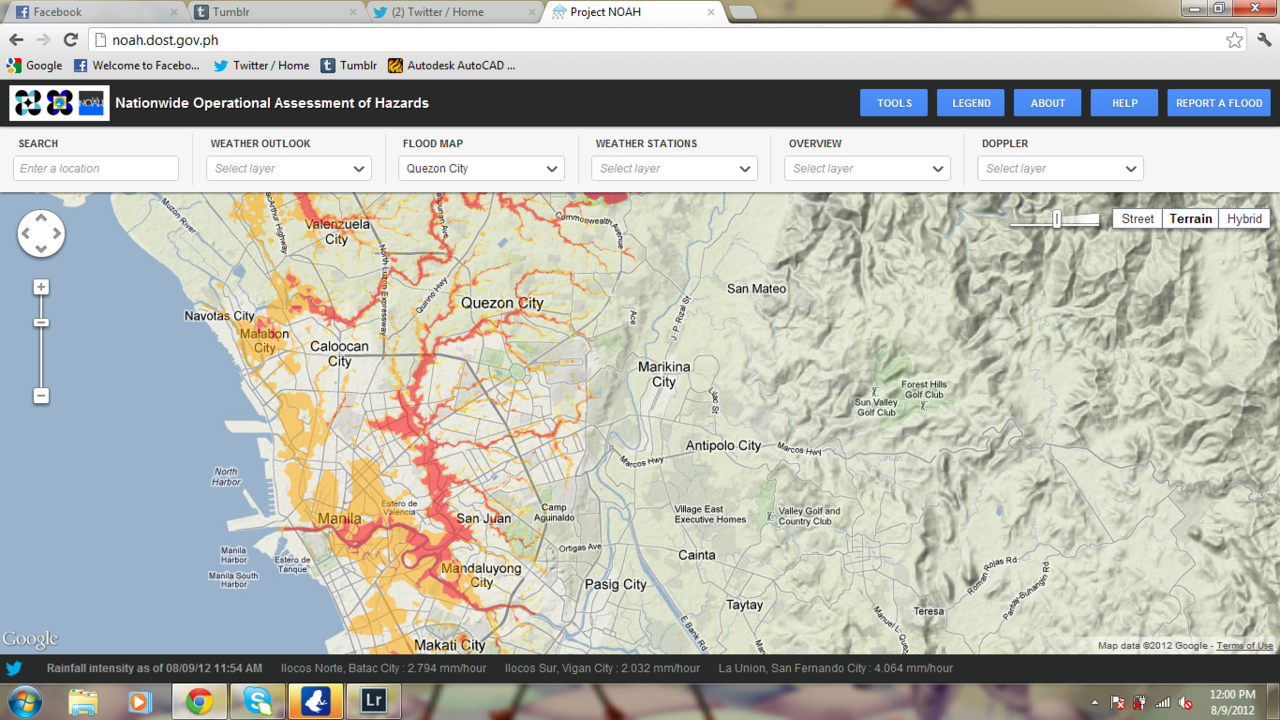
More recently, blogger the urbanhistorian reproduced a Project Noah map displaying the 100 year flood map of Manila and Quezon City: at the time of last year’s Hagabat, the blogger pointed out the areas hit by flooding basically correspond to the map, which is based on historical data:
Paolo Alcazaren, architect and urban planner, has written extensively on the historical developments I sketched out above, and if you’d like to know more, consult the links in my Tumblr entry, Parks, Urban Planning, and Public Health. In the aftermath of last year’s Habagat, Alcazaren also sketched out a simple explanation of why flooding seems to be getting worse:
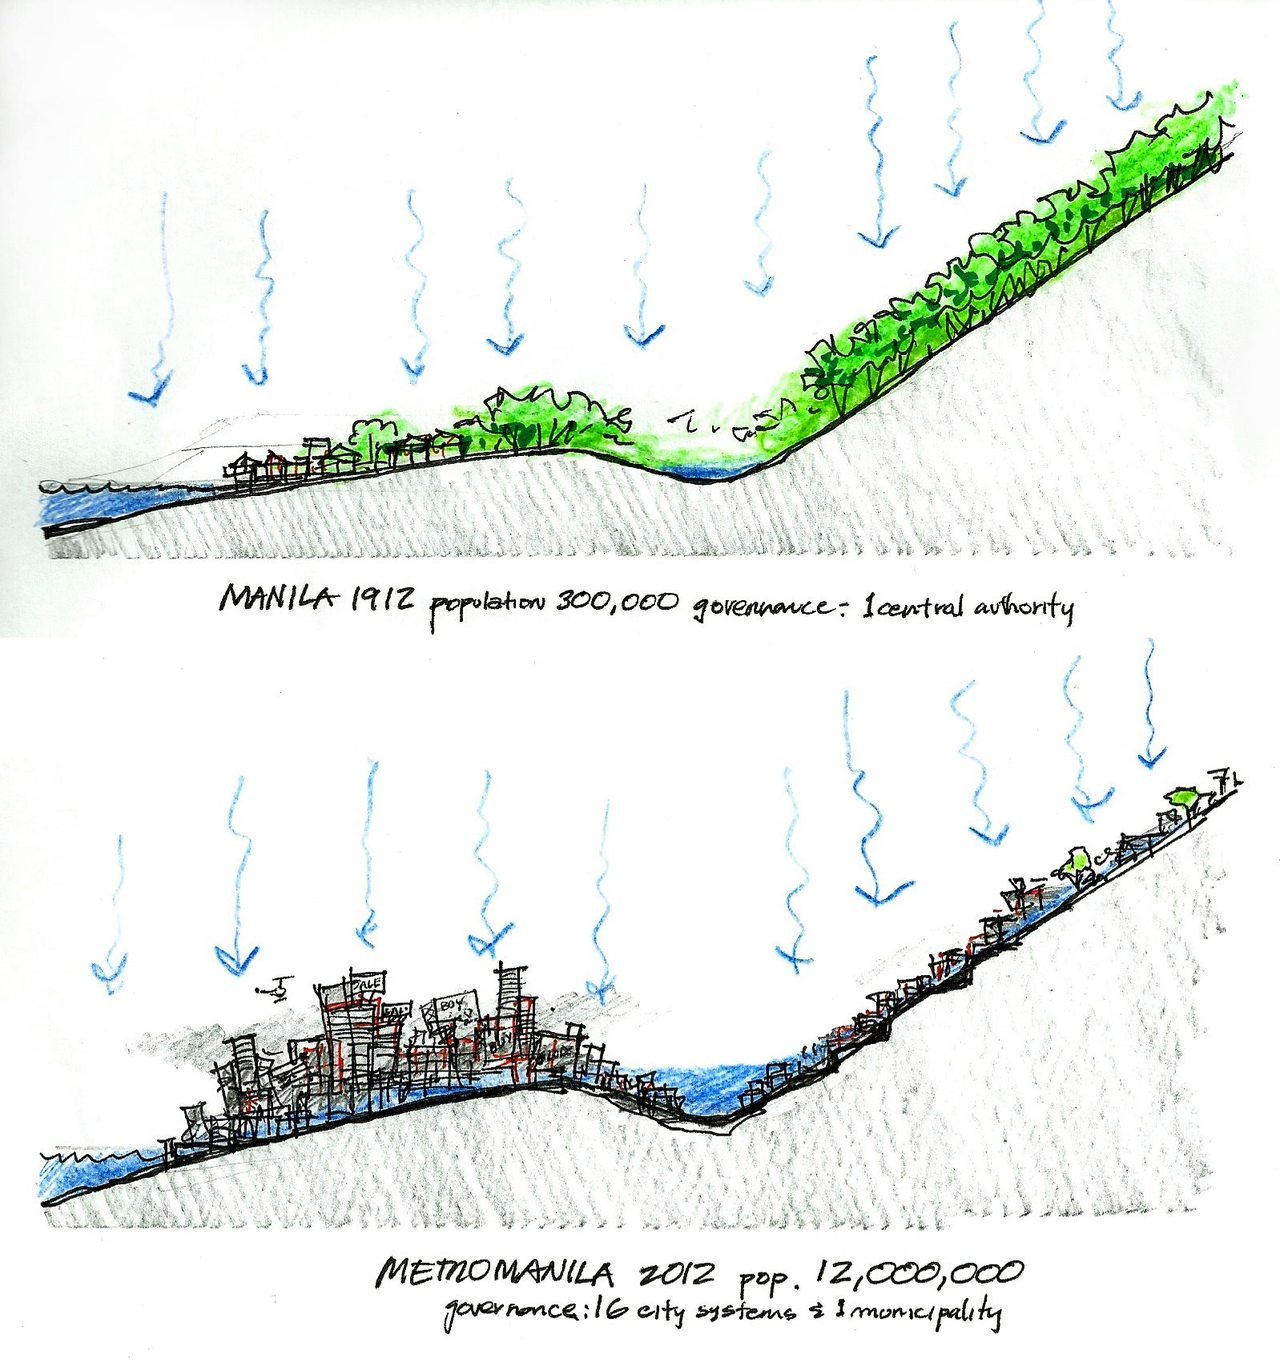
Alcazaren is a strong advocate of revisiting the governance system for the National Capital Region; that aside, what the preceding tells us is that scientists and urban planners look at our surroundings and they can pretty much predict where it will flood, and why. The question then, is can flooding be eliminated, or its effects mitigated?
In June, 2013, the Department of Public Works and Highways presented its Flood management master plan for Metro Manila and surrounding areas to the public. The presentation makes for interesting reading. For this entry, I’d like to focus on some parts of the presentation.
First, the report looked at an ecosystem, so to speak, much wider than Metro Manila alone: the interaction of rivers (and river basins) and mountains, outlined in red:

A comprehensive plan for the region –NCR and as far Cavite, Rizal, and Laguna, all provinces heavily affected by this year’s Habagat– entails interventions in these areas. As the report puts it, flooding manifests itself in three broad areas:
1. Huge volume of water coming from Sierra Madre
2. Drainage capacity constraints in core area of Metro Manila
3. Low-lying communities around Manila Bay and Laguna Lake
The plan proposes to address each by, for example, building a dam in Montalban, to turn the inflow of 3,600 cubic meters per second of water, into a controlled discharge of 900 cubic meters of water per second, and then the construction of a “retarding basin” (holding area) between the Tumana Bridge and the San Mateo Bridge, to further reduce the 900 cubic meters of water per second. If you remember Ondoy and Pepeng, it was the sudden deluge of water coming down from the mountains that really magnified the scale of the disaster as the water accumulated in Metro Manila and environs faster than it could go out to the sea.
For Metro Manila itself, the plan calls for the rehabilitation of 15 major pumping stations and the rehabilitation of drainage channels. This is what all the activity involving the cleanup of esteros, the transfer of vulnerable informal settler families, has been all about; it’s also why there has been a lot of work along major roads and the construction of major infrastructure in the España area in Manila.
Another aspect of the plan involves Laguna de Bai, as follows:

1. Putting up a road dike around the lake with pumping stations
2. Lakeshore land raising with road and future developments
3. Construction of a spillway that will cut through the heavily built-up Parañaque City and another one that will go through to the Pacific Ocean
4. Dredging works
5. River improvements for the selected inflow rivers of the lake developments
The old scheme for Laguna de Bai had been scrapped on the following grounds, see the 2011 SONA Technical Report:
2.3.2. Cancellation of the Laguna Lake Rehabilitation Project. On 17 June 2011, the President cancelled the P18.5 billion Laguna Lake Rehabilitation Project (LLRP) due to inconsistencies between the project components and its intended objectives; and the lack of transparency in the review and approval of the project. A DENR study found out that due to heavy deforestation and erosion, the areas to be dredged would end up being silted again in three (3) years without massive rehabilitation of the watersheds. The DENR further noted that the approval of the supply contract was done without any thorough review. In addition, the Project’s Economic Internal Rate of Return (EIRR) of 7.04%, which considers only the project’s quantified economic benefits, does not meet the 15% minimum hurdle rate or the minimum acceptable rate of return. In the end, despite the laudable objectives, the questionable project components of the LLRP justified its cancellation.
Instead, the plan outlined above took its place.
As far as Metro Manila itself is concerned, the situation may be said to have improved somewhat from the last Habagat, last year: and markedly improved since Ondoy/Pepeng. Even the España area seems to have drained pretty fast, while the tunnels in EDSA didn’t become impassible. This is not to say there was no flooding: but some people have pointed out that draining has improved. This is noteworthy considering the volume of water reported, which is that 2-3 times the entire monthly average fell on Metro Manila in the span of 1-2 days.
What was noticeable, however, was the South, which is covered in graphic terms in Mike Tan’s Inquirer column today, Heads up, Mega Manila:
Only two weeks ago, I was talking with a University of the Philippines professor who lives in San Pedro, Laguna, one of the most adversely affected towns. She mentioned how prone their area had become to flooding even with mild rains—something that was unthinkable a decade ago. She blamed the flooding on the many subdivisions that were allowed on the perimeter of the lake, including on reclaimed land. San Pedro is among the towns most badly affected by this week’s rains.
Governor Ejercito complained that the lake had become the “septic tank of Metro Manila” and said he and his people were looking for solutions for the overflowing of the lake, perhaps through a Pacific spillway. For some years now there has been talk of a Laguna de Bay Flood Control Dike Expressway (also known as the C-6 Extension) that will go from San Pedro to Siniloan.
The spillways are, as you’ve seen, part of the master plan outlined above. Other aspects pointed out by Tan, however, will require people to insist on zoning standards being applied within private developments. Recall how, in the wake of Ondoy and Pepeng, residents of neighborhoods applied pressure on property developers to fix drainage, and also, for local and national government to start taking into account the increased frequency and severity –not to mention unpredictability– of torrential rains.
Solutions also include reducing the use of plastics for shopping, etc., and the Total Log Ban imposed in 2011. Some of the efforts in terms of risk reduction and disaster management can be gleaned from the SONA Technical Reports:
In 2010-2011, from the 2011 SONA Technical Report:
2.1 Pursued geohazard assessment and mapping. The Hazard Mapping and Assessment for Effective Community-Based Disaster Risk Management (READY) Project addresses the concerns on disaster risk management (DRM) at the local level. It empowers the most vulnerable provinces and communities in the country by enabling them to prepare disaster risk management plans. Under the project, the following were accomplished:
2.1.1. The government has completed the geohazard assessment and mapping of the entire country with a scale of 1:50,000[40]. It covers 1,643 cities and municipalities.
2.1.2. Geohazard maps[41] were posted in the website of the Mines and Geosciences Bureau to make geohazard information more accessible to public users. A total of 65,000 geohazard maps were provided to LGUs, national and local disaster management agencies, and other stakeholders. Advisories to barangays in areas that are likely to be seriously affected by landslides and flooding were re-issued.
2.1.3. Multi-hazard maps[42] of 18 out of the 66 hazard-prone provinces in the country were also produced. As of April 2011, a total of 102 multi-hazard maps in a 1:50,000 scale and 17 in a 1:10,000 scale have been completed. Six (6) of these were completed in July 2010. Through these maps, areas prone to floods, landslides, and other geo-hazards have been identified, enabling local government units to better prepare themselves in responding to and mitigating the effects of national calamities and other hazards.
2.1.4. The government also initiated the detailed mapping of 30 cities and municipalities in areas critical to landslides and flooding at a scale of 1:10,000.
2.2 Improved weather forecasting. The President mandated the DOST and PAGASA to improve its typhoon tracking and weather forecasting systems. The following were accomplished:
2.2.1 Implemented hourly weather forecasts and timely reports on significant weather activities through locally-developed and upgraded forecasting tools: Automated Weather Stations (AWS)[43], rain gauges, flood monitoring and warning systems, Doppler radars, and weather buoys for maritime lanes.
2.2.2 In July 2010, Metro Manila was hit by Typhoon Basyang, without any warning from PAGASA. During that time, the country would get weather updates every 6 hours. Thereafter, the government instituted the provision of hourly updates on the latitude and longitude positions of Tropical Cyclones and distance to the nearest community during severe weather conditions, on top of the usual regular reports issued every 6 hours during normal weather situations. The hourly reports enhanced public preparedness and provided the citizens with timely and accurate weather forecasts during times of extreme weather conditions, thereby increasing protection of life, property and livelihood.
2.2.3 Acquired Forecasters’ Workstations to help forecasters and users display, screen, combine multiple windows, animate, overlay, and manipulate available weather data for better weather tracking.
2.2.4 In light of the recent earthquake that triggered the nuclear mishap in Japan, the DOST-Philippines Nuclear Research Institute (PNRI) was also able to provide correct information and awareness about the implications of the nuclear leak to the Philippines.
2.2.5 The DOST plans to locally-develop more forecasting tools such as the meteorological buoy, shaker table, landslide sensors, and 3D mapping device as well as enhance the technical capability of the forecasters.
From 2011-2012, Completed the Delineation of Forest Boundaries in 75 provinces; continued Geohazard Mapping; implemented Project NOAH, new and additional sensors for river levels, soil erosion, etc.; new Doppler Radars. For these and more details, see pp. 47-53 of the 2012 SONA Technical Report.
From 2012-2013 to date, (2013 SONA Technical Report):
Completed multi-hazard mapping of the 28 most disaster-prone areas in the country; completion of the multi-hazard map for Metro Manila by 2014; increased number of devices for providing data for Project NOAH (helping forecast and warn; no lives were lost in Marikina during 2012 Habagat; Sendong-like disaster prevented in Cagayan de Oro City with improved forecasts and warnings) .
As for the DPWH Plan above, the 2013 SONA Technical Report mentions that,
Recognizing the urgent need to ease flooding in these areas, the
government approved an initial P5-billion funding for high-impact flood
control projects, which will provide immediate effects within 15 to 18
months of their implementation. These projects are now in various stages
of implementation. [There are 12 completed sub-projects as of 25 June 2013 in Valenzuela City, Bulacan, Malabon City, Marikina City, Pasig City, and Rizal.]In addition to the high-impact flood control projects, the DPWH is
implementing 416 projects worth P6.2 billion 219 in Metro Manila
involving the improvement of drainage, esteros, waterways, and
riverways, to improve their carrying capacity. 220 These include the
construction/rehabilitation of the Blumentritt Interceptor Catchment
Area221 (drainage system) from Estero De Sunog Apog to Piy Margal in
Sampaloc, Manila amounting to P600 million, which started in March
2013 and targeted to be completed in July 2014.To complement these efforts, the government allocated MMDA P1.6
billion to rehabilitate and upgrade 12 priority pumping stations, which
will benefit a total of 804,662 people or roughly 161,000 families living
in 361 barangaysin three cities.The DPWH is implementing 3,998 flood control and drainage projects
nationwide worth P32.08 billion. Of these projects, 76 percent or
3,029 projects have been completed.The DPWH has also been developing master plans and feasibility studies
for flood control and drainage projects in 56 river basins (e.g.,
Pampanga, Tagoloan, Cagayan, Agno, Imus, Bicol, and Cagayan de
Oro), for implementation from 2009 to 2034. Further, the DPWH,
DENR, DA, and DAR have collaborated to implement water-relatedconvergence projects in river basins since 2011. 225 This approach
optimizes the benefits and impact of the government’s water
development projects.
For more details, see pp. 82-87 of the 2013 Report.